Bitcoin Price Under Pressure Amid Trade Concerns, But Rare Patterns Suggest Eventual Rebound
Bitcoin’s price has struggled to gain momentum this week, weighed down by ongoing trade concerns between the United States and its top partners. Despite this, two rare chart patterns have formed, indicating a potential rebound in the cryptocurrency’s price.
The crypto fear and greed index has slipped into the fear zone, currently sitting at 35, while the CNN Money index has fallen to 39. This downturn in sentiment is largely attributed to the escalating trade tensions, which have seen the US impose tariffs on Chinese goods worth over $450 billion.
The uncertainty surrounding trade has led to a cautious approach among investors, with many opting to remain on the sidelines. This is reflected in the weak futures open interest and spot Bitcoin ETF inflows, which have declined to around $57 billion from this year’s high of $68 billion.
The Federal Reserve’s recent monetary policy meeting has also contributed to the bearish sentiment, with the bank adopting a more hawkish tone and hinting at only two interest rate cuts this year. Historically, Bitcoin and other altcoins have performed well when the Fed has taken a dovish approach.
Technical Indicators Point to Potential Rebound
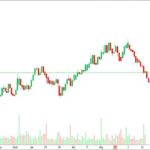
Despite the current bearish sentiment, technical analysis suggests that Bitcoin’s price may be due for a rebound. A weekly chart shows the formation of two rare chart patterns: a cup and handle pattern, and a bullish flag pattern.
The cup and handle pattern, which formed between November 2021 and November last year, is characterized by a horizontal line and a rounded bottom. The profit target for this pattern is established by measuring the depth of the cup and then measuring the same distance from the cup’s upper side. In this case, the depth is approximately 80%, suggesting a potential rebound to $123,000.
The bullish flag pattern, which has a long vertical line and a rectangle pattern, also points to a potential breakout. The size of the flag pole is approximately 55%, and measuring this distance from the upper side suggests a potential breakout of $166,000.
While these technical indicators are promising, it’s essential to note that the weekly chart used to identify these patterns may take time to play out. The cup and handle pattern, for example, took around three years to form, suggesting that a Bitcoin price surge to $166,000 may be a long-term prospect.
Bitcoin’s price may be under pressure, but rare chart patterns suggest a potential rebound is on the horizon.
Tips for Investors
- Keep a close eye on trade tensions and their impact on the global economy.
- Monitor the Federal Reserve’s monetary policy decisions and their potential impact on Bitcoin’s price.
- Consider diversifying your portfolio to mitigate risks in the cryptocurrency market.
Stay up-to-date with the latest cryptocurrency news and trends on Global Crypto News.


